Isuzu D-Max / Isuzu Rodeo (TFR/TFS). Manual — part 19
4JA1-TC/4JH1-TC ENGINE DRIVEABILITY AND EMISSIONS
6E–71
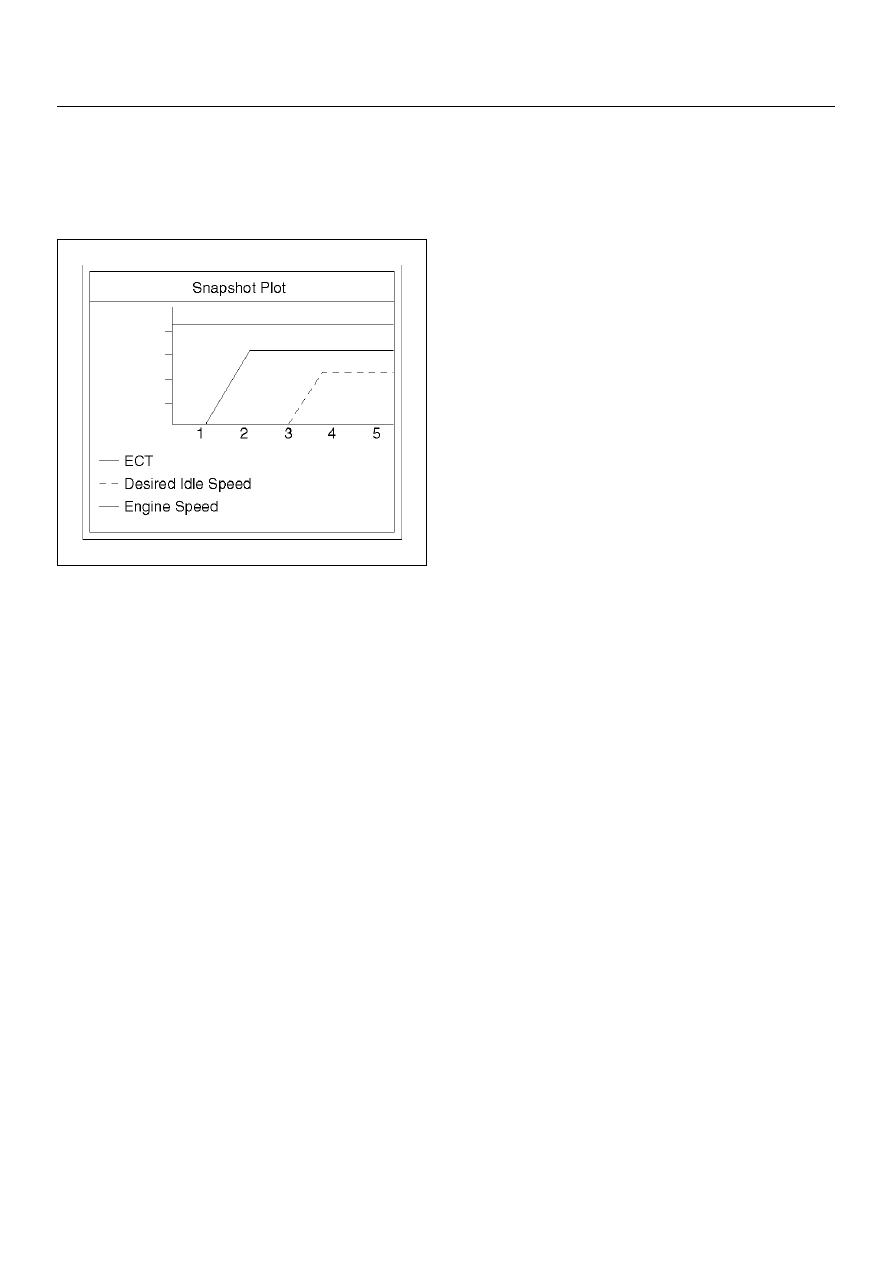
Plotting Snapshot Graph
This test selects several necessary items from the data
list to plot graphs and makes data comparison on a long
term basis. It is an effective test particularly in emission
related evaluations.
For trouble diagnosis, you can collect graphic data
(snap shot) directly from the vehicle.
You can replay the snapshot data as needed. Therefore,
accurate diagnosis is possible, even though the vehicle
is not available.
6E–72
4JA1-TC/4JH1-TC ENGINE DRIVEABILITY AND EMISSIONS
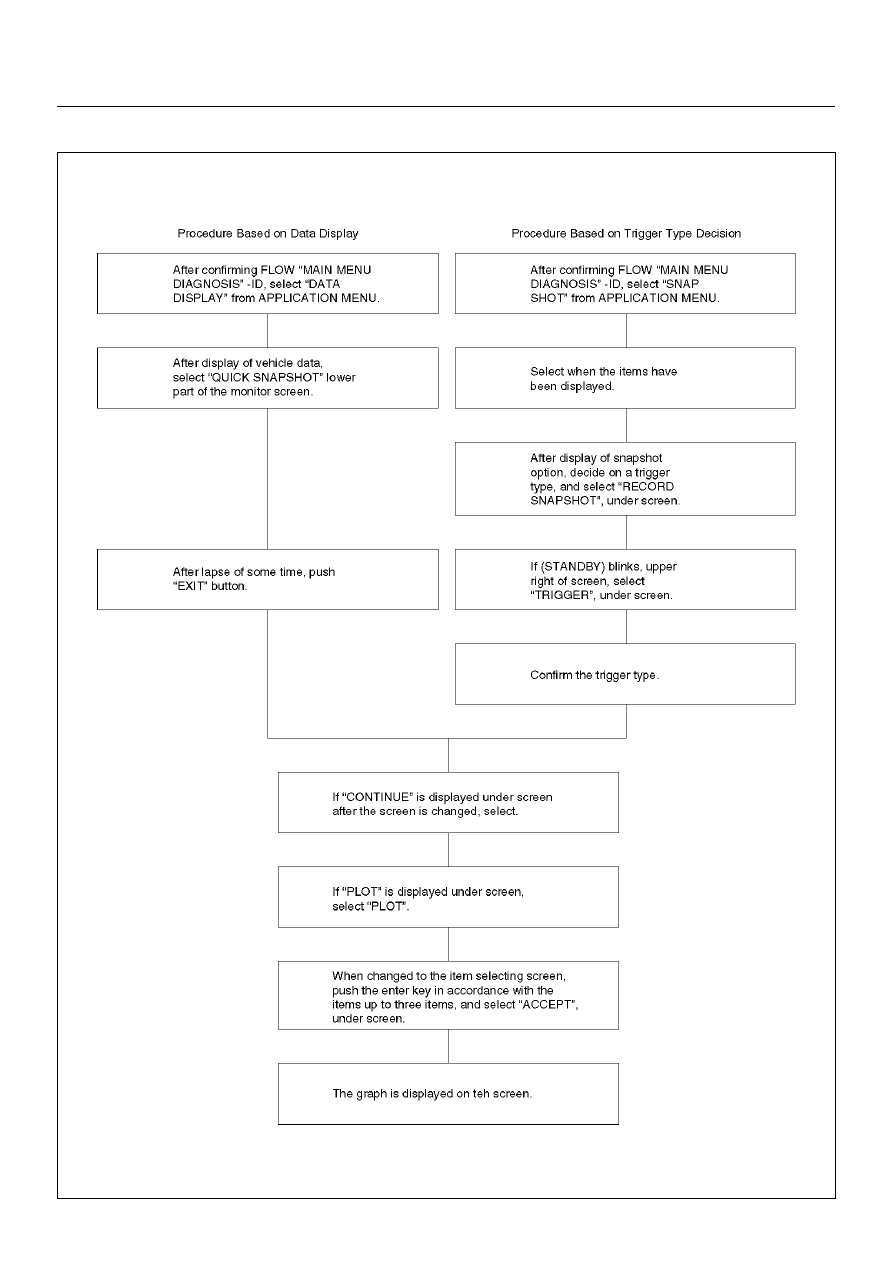
Plotting Graph Flow Chart (Plotting graph after obtaining vehicle information)
4JA1-TC/4JH1-TC ENGINE DRIVEABILITY AND EMISSIONS
6E–73
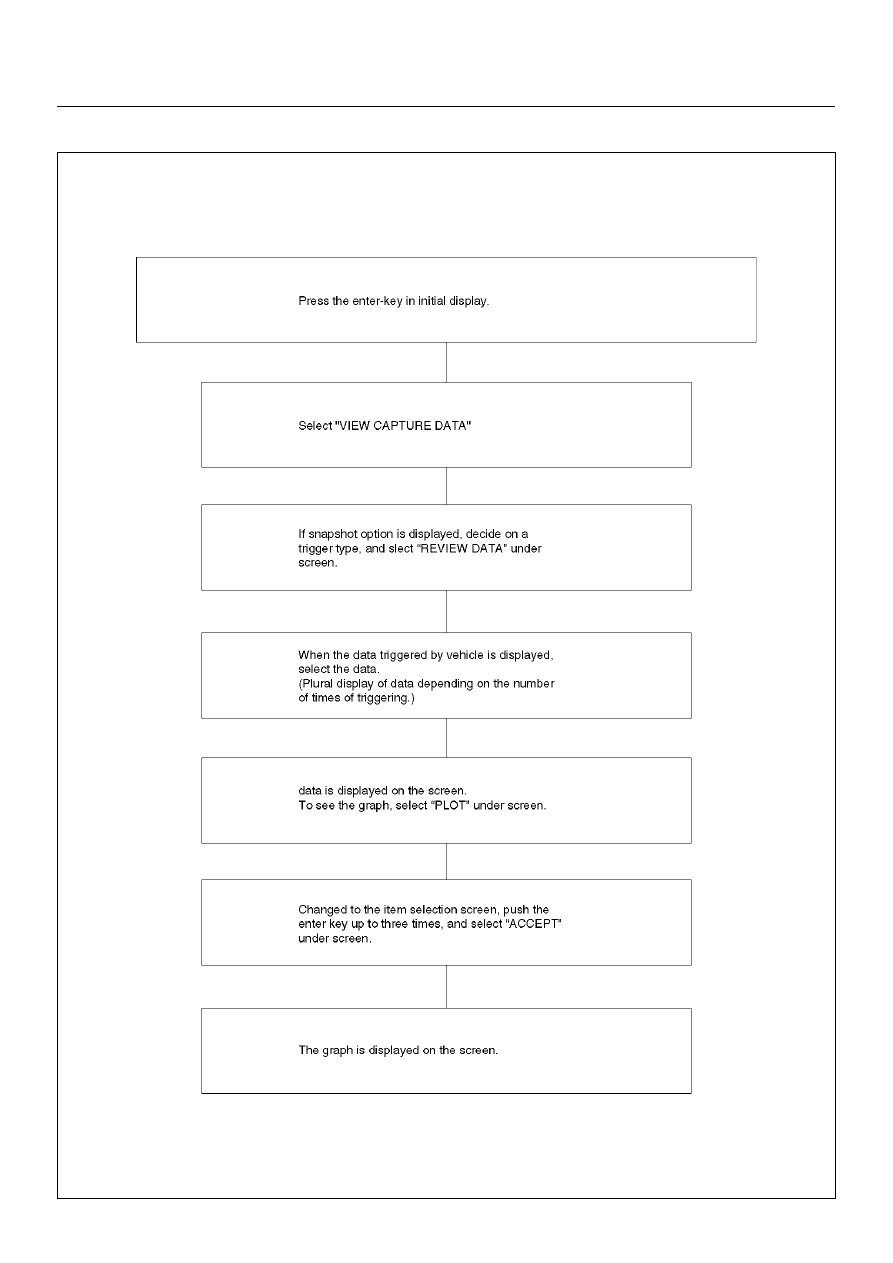
Flow Chart for Snapshot Replay (Plotting Graph)
6E–74
4JA1-TC/4JH1-TC ENGINE DRIVEABILITY AND EMISSIONS
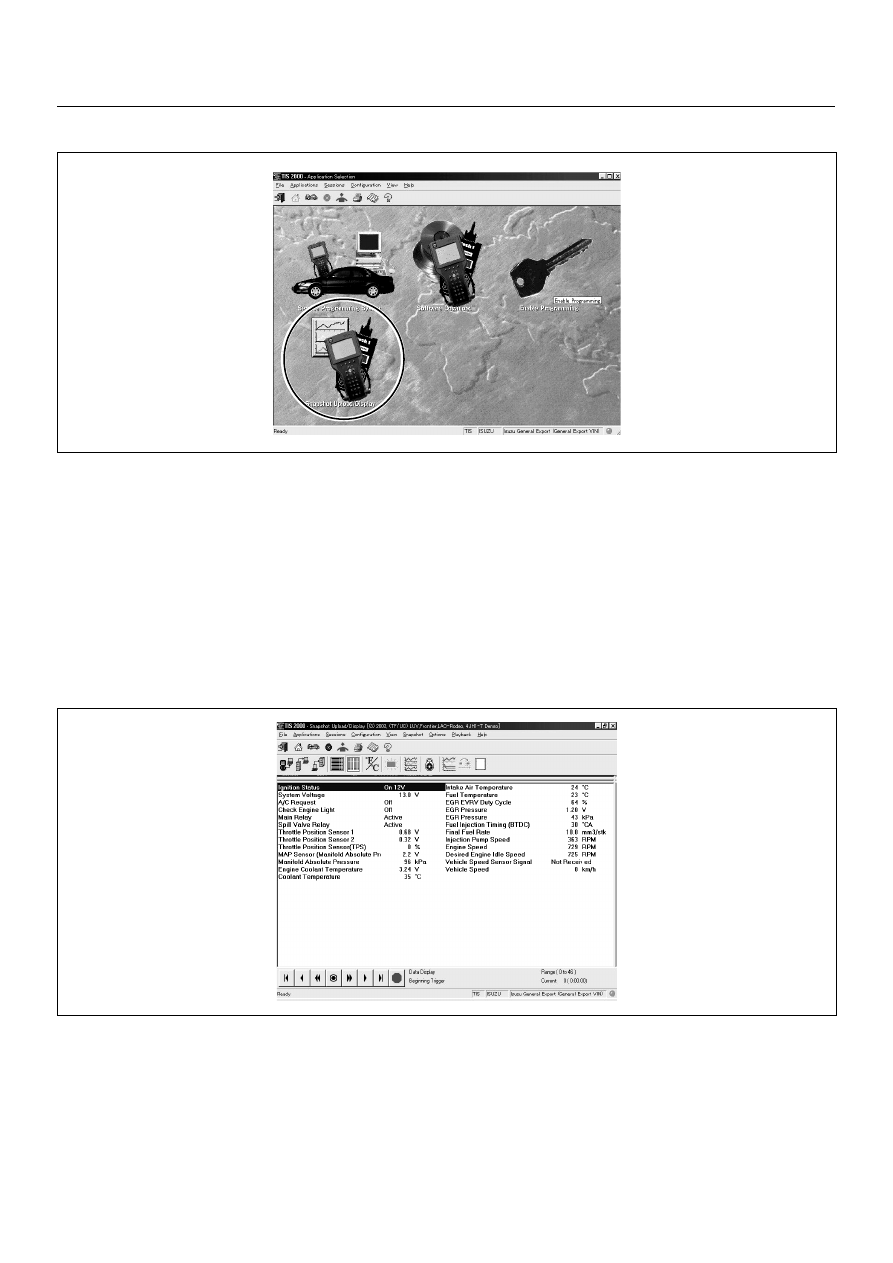
SNAPSHOT DISPLAY WITH TIS2000
Procedures for transferring and displaying Tech2
snapshot data by using TIS2000 [Snapshot Upload]
function is described below.
Snapshot data can be displayed with [Snapshot Upload]
function included in TIS2000.
By analyzing these data in various methods, trouble
conditions can be checked.
Snapshot data is displayed by executing the three steps
below shown:
1. Record the snapshot data, in Tech2.
2. Transfer the snapshot data to PC.
Нет комментариевНе стесняйтесь поделиться с нами вашим ценным мнением.
Текст