Isuzu D-Max / Isuzu Rodeo (TFR/TFS). Manual — part 1741

DIAGNOSIS 7A2-15
F0: Low & Reverse Brake Solenoid
Low & Reverse Brake Solenoid
Low & Reverse Brake Duty
0%
−
Press "Active" key.
Then, duty datio is indicated 100 % and "clicking sound" is
generated from the transmission control valve.
−
Press "Inactive" key.
Then, duty datio is indicated 0 % and "clicking sound" is
generated from the transmission control valve.
−
Press "Quit" Key to cancel the test.
F0: Low & Reverse Brake Solenoid
F1: 2-4 Brake Solenoid
F2: High Clutch Brake Solenoid
F3: Low Clutch Solenoid
F4: Line Pressure Solenoid
F5: Lock Up Duty Solenoid
Test procedure is same as "F0: Low & Revese Brake
Solenoid"
The circuit is normal if clicking sound is generated in
accordance with Tech 2 instruction.
7A2-16 DIAGNOSIS
INTERMITTENT DIAGNOSIS
If the Tech 2 displays any codes as intermittent, or if after a test drive any codes does not reappear, the problem is
most likely a faulty electrical connection or loose wiring.
Terminals should always be the prime suspect.
Intermittent rarely occur in sophisticated electronic components such as the TCM.
When an intermittent problem is encountered, check suspect circuits for:
•
Poor terminal to wire connection.
•
Terminals not fully seated in the connector body.
•
Improperly formed or damaged terminals.
•
Loose, dirty or damaged terminals.
Any time you have an intermittent in more than one circuit, check whether the circuits share a common ground
connection.
•
Pinched or damaged wires.
•
Electric interference.
Check for improperly installed electrical options, such as light, radios, etc.
Use the F2: Snapshot mode of the Tech 2 to help isolate the cause of an intermittent fault. The snapshot mode will
record information before and after the problem occurs. Set the snapshot to "Trigger" on the suspected code or, if
you notice the reported symptom during test drive, trigger the snapshot manually.
After the snapshot has been triggered, command the Tech 2 to play back the flow of data recorded from each of the
various sensors. Sings of intermittent fault in a sensor circuit are a sudden unexplainable jump in data values out of
the normal range.
DIAGNOSIS 7A2-17
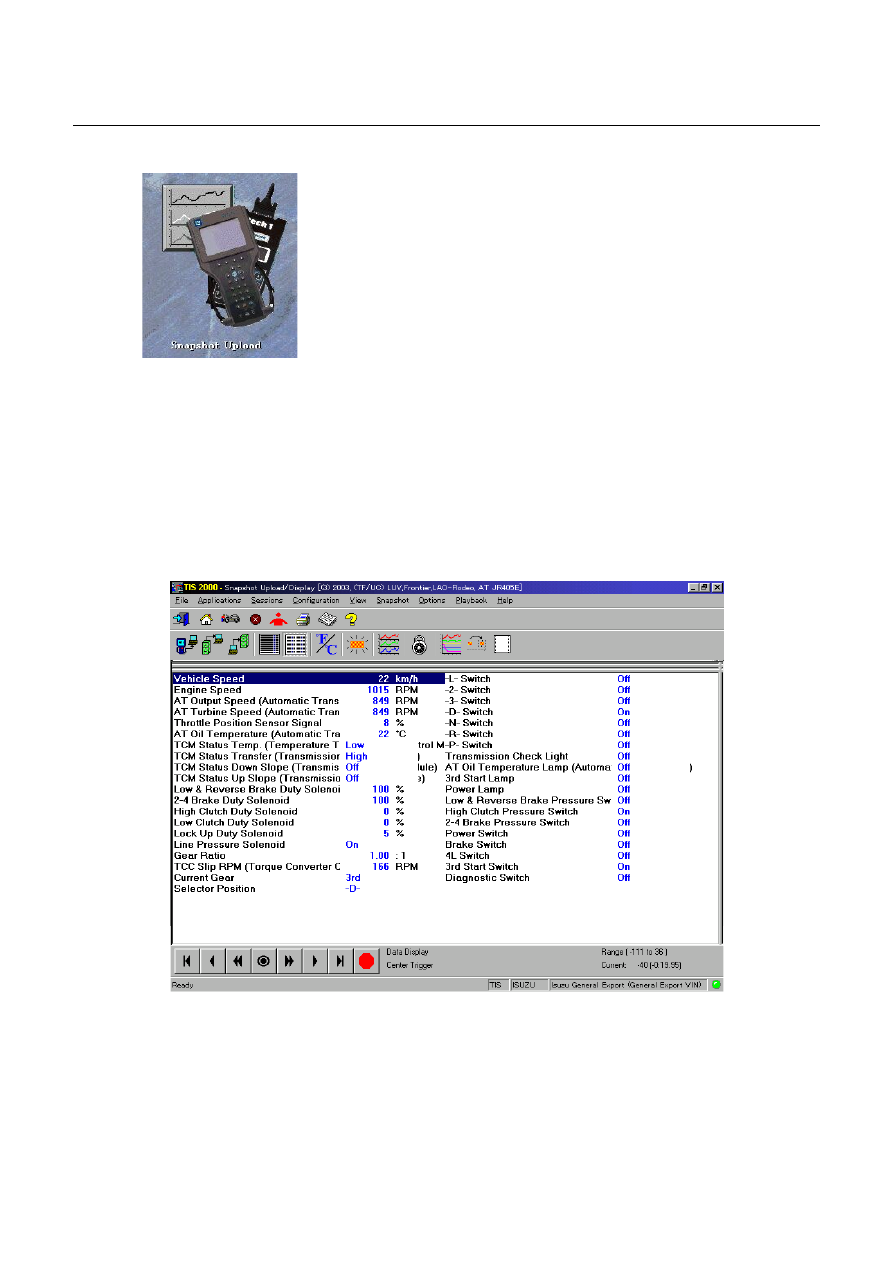
SNAPSHOT DISPLAY WITH TIS2000 (For Snapshot Data Analysis)
Procedures for transferring and displaying Tech2 snapshot
data by using TIS2000 [Snapshot Upload] function is described
below.
Snapshot data can be displayed with [Snapshot Upload]
function included in TIS2000.
By analyzing these data in various methods, trouble conditions
can be checked.
Snapshot data is displayed by executing the three steps below
shown:
1.
Record the snapshot data, in Tech2.
2.
Transfer the snapshot data to PC.
After recording the snapshot in Tech2, transfer the data from Tech2 to PC by the below procedures.
1.
Start TIS2000.
2.
Select [Snapshot Upload] on the TIS2000 start screen.
3.
Select [Upload from trouble diagnosis tool (transfer from diagnosis tester)] or click the corresponding icon of
the tool bar.
4.
Select Tech2, and transfer the recorded snapshot information.
5.
Select the transferred snapshot.
6.
After ending transfer of the snapshot, data parameter list is displayed on the screen.
3.
Snapshot data is displayed with TIS2000 [Snapshot Upload] function.
Snapshot is stored in the PC hard disk or floppy disk, and can be displayed any time.
Stored snapshot can be displayed by the below procedures.
1.
Start TIS2000.
2.
Select [Snapshot Upload] on the TIS2000 start screen.
3.
Select [Open the existing files] or click the corresponding icon of the tool bar.
4.
Select the transferred snapshot.
5.
Open the snapshot, to display the data parameter list on the screen.

7A2-18 DIAGNOSIS
Graph display
Values and graphs (Max. 3 graphs):
1.
Click the icon for graph display. [Graph Parameter] window opens.
2.
Click the first graph icon of the window upper part, and select one parameter from the list of the window lower
part. Selected parameter is displayed nest to the graph icon. Graph division can be selected in the field on the
parameter right side.
3.
Repeat the same procedures with the 2nd and 3rd icons.
4.
After selecting all parameters to be displayed (Max. 3 parameters), click [OK] button.
5.
Parameter selected is displayed in graph form on the right of the data parameter on the screen.
6.
Graph display can be moved with the navigation icon.
7.
For displaying another parameter by graph, click the parameter of the list, drug the mouse to the display screen
while pressing the mouse button and release the mouse button. New parameter is displayed at the position of
the previous parameter. For displaying the graph display screen in full size, move the cursor upward on the
screen. When the cursor is changed to the magnifying glass form, click the screen. Graph screen is displayed
on the whole screen.
Нет комментариевНе стесняйтесь поделиться с нами вашим ценным мнением.
Текст