Isuzu KB P190. Manual — part 998
7A2-26 TRANSMISSION CONTROL SYSTEM (AW30–40LE)
Snapshot Display With TIS2000
Procedures for transferring and displaying Tech2
snapshot data by using TIS2000 [Snapshot Upload]
function is described below.
Snapshot data can be displayed with [Snapshot Upload]
function included in TIS2000.
By analyzing these data in various methods, trouble
conditions can be checked.
Snapshot data is displayed by executing the three steps
below shown:
1. Record the snapshot data, in Tech2.
2. Transfer the snapshot data to PC.
TRANSMISSION CONTROL SYSTEM (AW30–40LE) 7A2-27
After recording the snapshot in Tech2, transfer the data
from Tech2 to PC by the below procedures.
1. Start TIS2000.
2. Select [Snapshot Upload] on the TIS2000 start
screen.
3. Select [Upload from trouble diagnosis tool (transfer
from diagnosis tester)] or click the corresponding
icon of the tool bar.
4. Select Tech2, and transfer the recorded snapshot
information.
5. Select the transferred snapshot.
6. After ending transfer of the snapshot, data
parameter list is displayed on the screen.
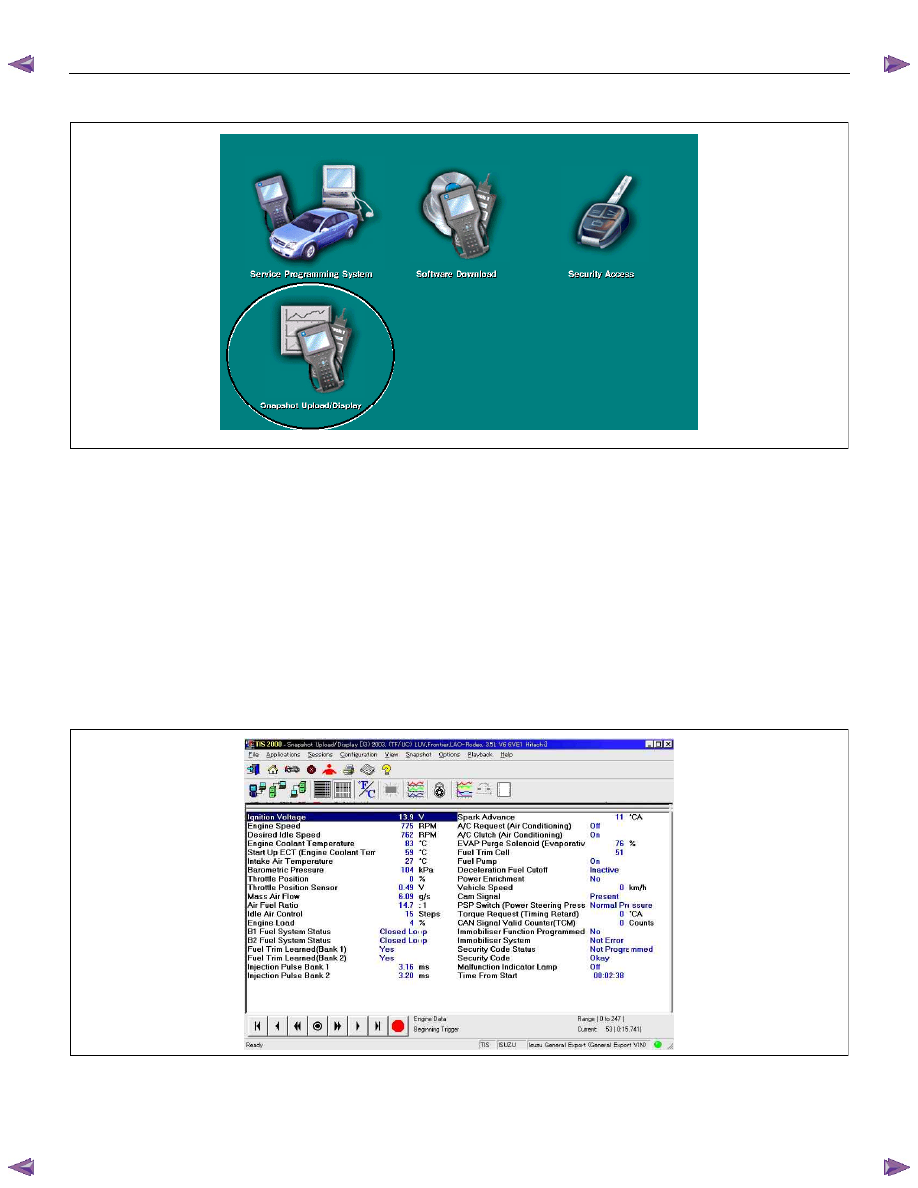
3. Snapshot data is displayed with TIS2000
[Snapshot Upload] function.
Snapshot is stored in the PC hard disk or floppy disk,
and can be displayed any time.
Stored snapshot can be displayed by the following
procedures.
1. Start TIS2000.
2. Select [Snapshot Upload] on the TIS2000 start
screen.
3. Select [Open the existing files] or click the
corresponding icon of the tool bar.
4. Select the transferred snapshot.
5. Open the snapshot, to display the data parameter
list on the screen.
7A2-28 TRANSMISSION CONTROL SYSTEM (AW30–40LE)
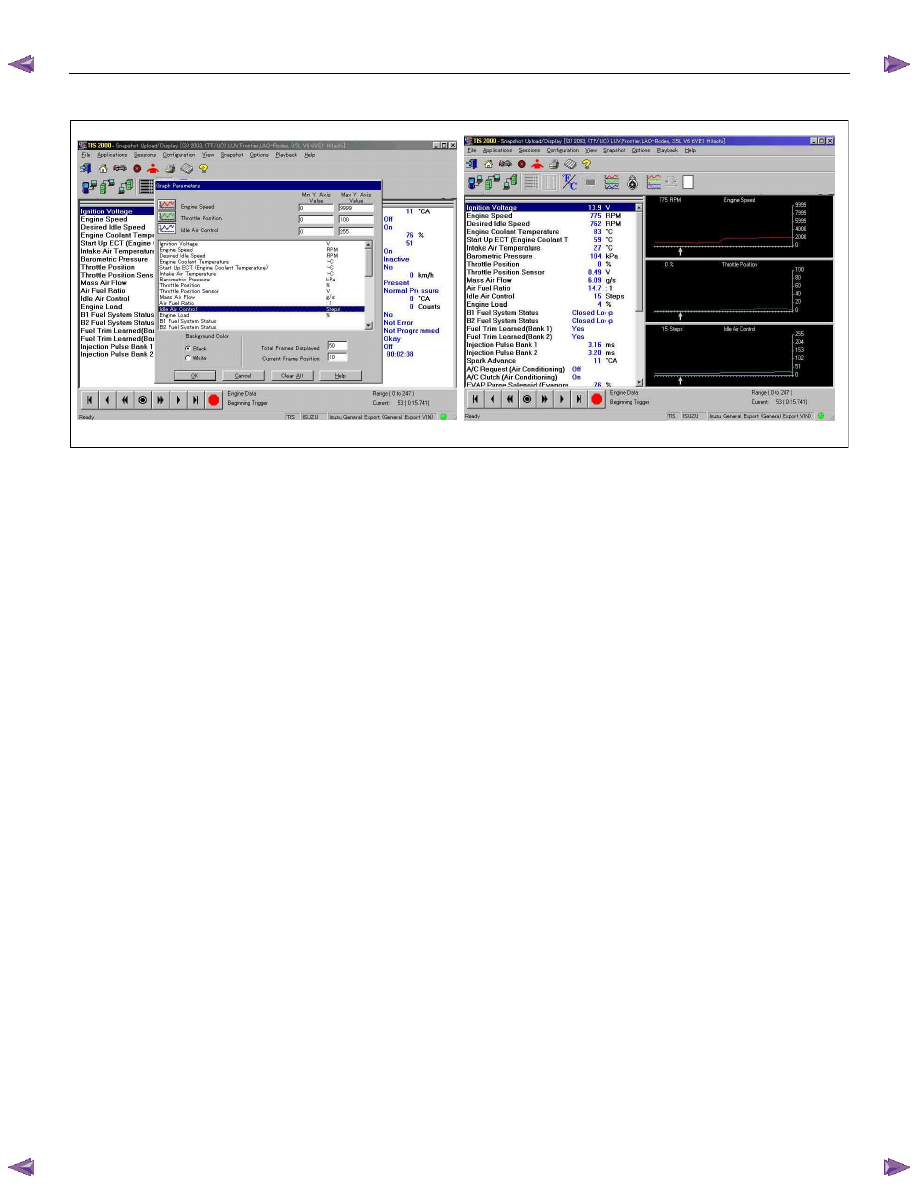
Graph display Values and graphs (Max. 3 graphs):
1. Click the icon for graph display. [Graph Parameter]
window opens.
2. Click the first graph icon of the window upper part,
and select one parameter from the list of the
window lower part. Selected parameter is
displayed next to the graph icon. Graph division
can be selected in the field on the parameter right
side.
3. Repeat the same procedures with the 2nd and 3rd
icons.
4. After selecting all parameters to be displayed
(Max. 3 parameters), click [OK] button.
5. Parameter selected is displayed in graph form on
the right of the data parameter on the screen.
6. Graph display can be moved with the navigation
icon.
7. For displaying another parameter by graph, click
the parameter of the list, drug the mouse to the
display screen while pressing the mouse button
and release the mouse button. New parameter is
displayed at the position of the previous
parameter. For displaying the graph display screen
in full size, move the cursor upward on the screen.
When the cursor is changed to the magnifying
glass form, click the screen. Graph screen is
displayed on the whole screen.
TRANSMISSION CONTROL SYSTEM (AW30–40LE) 7A2-29
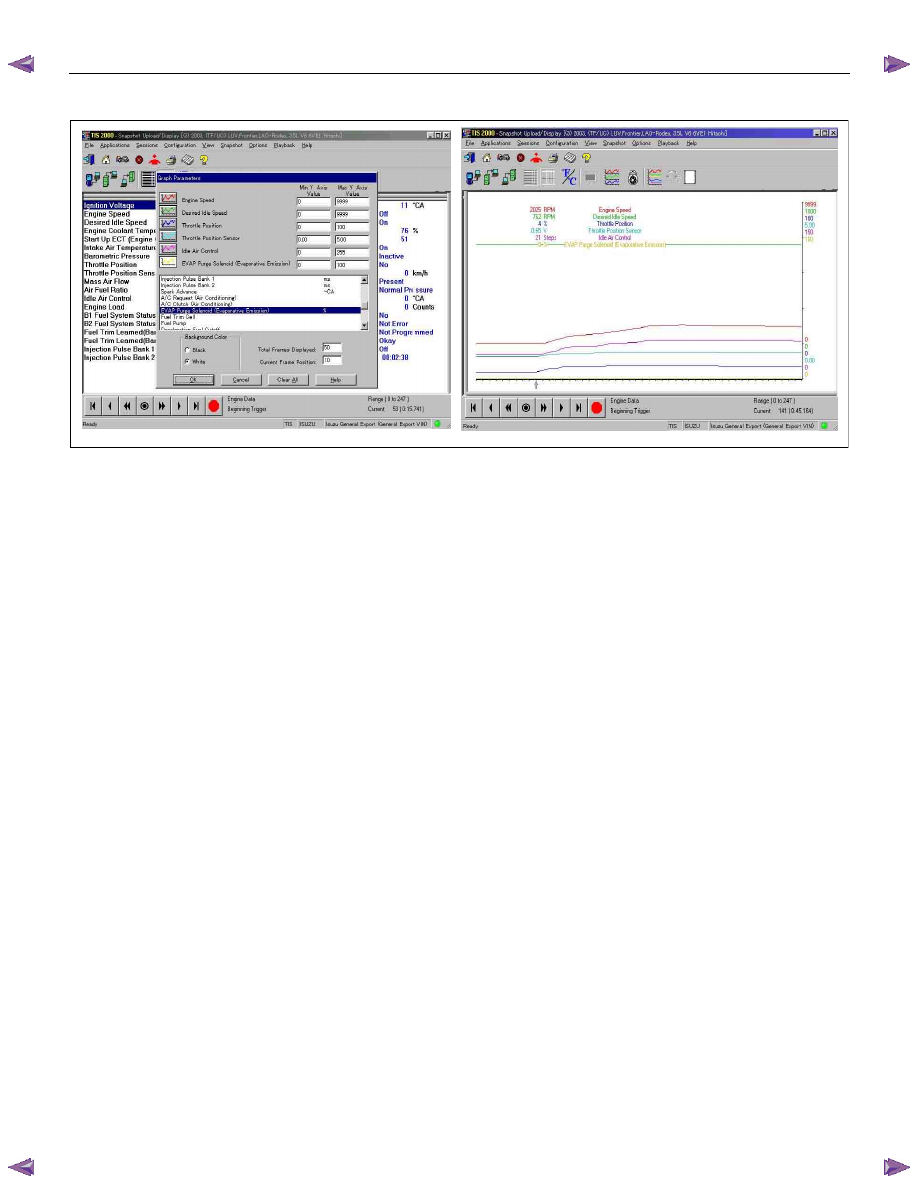
Display of graphs on one screen (Max. 6 graphs):
1. Click the 6 graph icon. [Graph Parameter] window
opens.
2. Click the graph icon, select the parameter to be
displayed from the list and change divisions
according to necessity.
3. Repeat the same procedures with the graph icons,
from the 2nd to 6th.
4. Click the [OK] button to display.
5. In this case, parameters are displayed only in
graph form. All parameters are displayed in one
graph.
6. The graph display screen can be moved with the
navigation icon.
Нет комментариевНе стесняйтесь поделиться с нами вашим ценным мнением.
Текст